
Last year we looked at 'How and why you should be tracking recruitment marketing results' to get you thinking more commercially about your marketing strategy. Following on from this piece, we're now going to take a deeper dive into reporting, from interpreting data to the behavioural elements that make up a good report. We aim to get more recruitment agencies to see the value of marketing, understand its role within the sales process and help managers prove the value of their activities.
Investing in recruitment marketing helps improve the candidate experience, create a talent pipeline, and increase client enquiries. Through digital campaigns and long-term, focused strategies, marketing has the power to improve brand awareness, accelerate results and increase ROI.
A good strategy starts with a clear business objective. Only then can you look closer at the marketing goals, appropriate channels and tactics. The final stage of recruitment marketing and often the forgotten or neglected stage is data analysis and reporting. This is a crucial step in your strategy. It allows you to identify areas for improvement, showcase the results from marketing activity and create an action plan for the future.
What are recruitment marketing reports, and what can they tell you?
As marketers, you have the power to make important decisions, manage budgets and influence wider business decisions.
Reports should offer a window into your activity with a clear focus on the KPIs unique to your business goals. The contents of a marketing report depends entirely on your business and the purpose of each report. Perhaps you want to see how your content is performing, where your leads are coming from, or maybe you need to provide your sales manager with a report of conversions and customer journeys.
Marketing reports should be valuable, not just to you as the marketing manager, but to everyone that will be receiving the report, from your CEO to your consultants and sales manager. So ask yourself, how does this report give each individual a snapshot of what they need to know?
What to measure.
It can be hard to know where to start when faced with Google Analytics. It's best to begin with a clear understanding of your objectives.
In our first blog of the series, we tackled metrics, identifying what you should be looking at and how to target your KPIs. Here we were able to split all marketing data into three main categories: buying signals, conversion metrics and commercial metrics. These metrics can tell you how your audience is interacting, what conversions you're seeing and how marketing results in MQLs, lead generation and revenue.
The best reports will give a concise summary for those with limited time to read, followed by in-depth pages that look closer at specific KPIs, backed up with the relevant data. Whilst each business has unique KPIs, we recommend, as a minimum, looking at the following data to give a clear picture of how marketing is impacting your businesses.
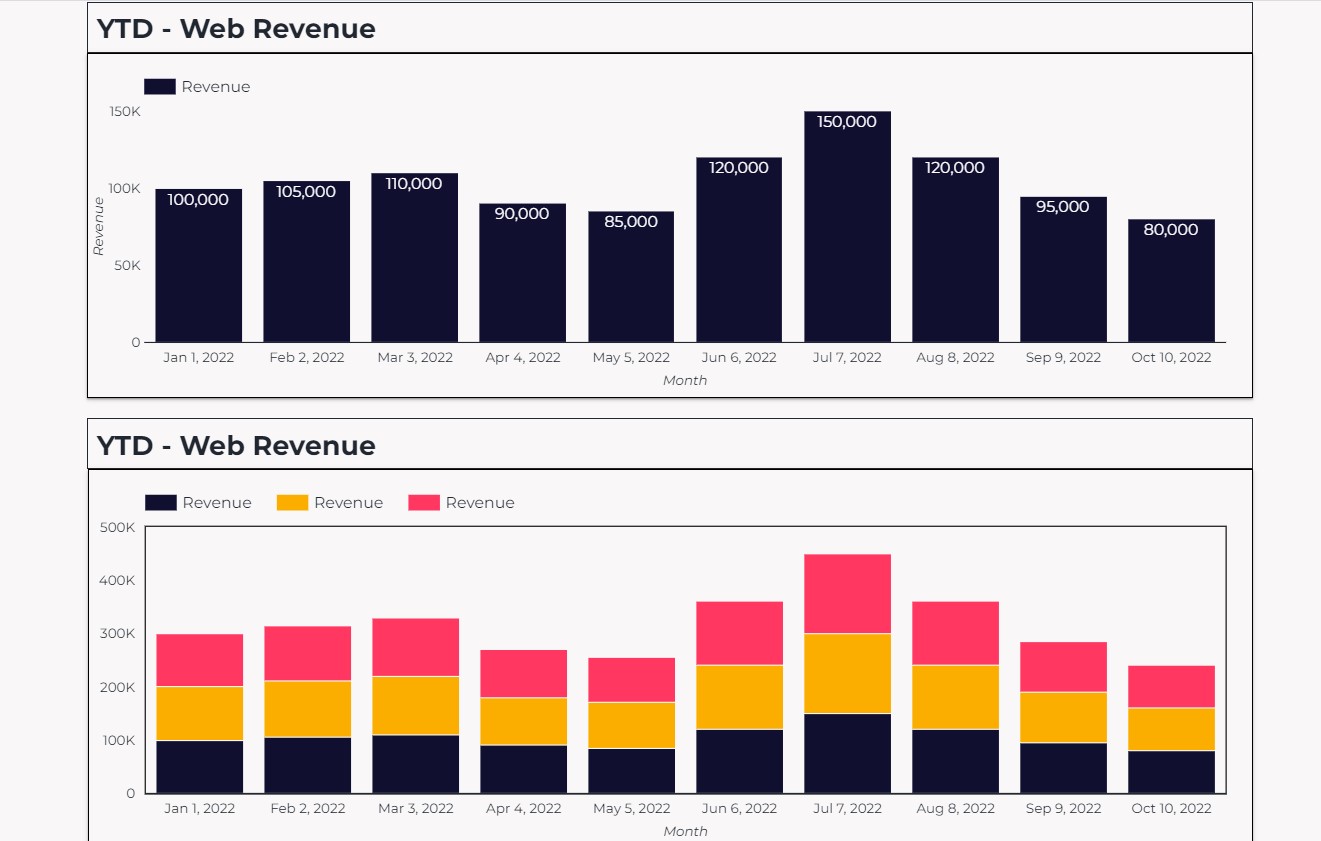
- Revenue generated from web leads.
- No. of sales leads from digital and how many of these went through to proposal stage. (to measure quality)
- Number of MQLs (marketing qualified leads) – This is vital if you're running a content strategy.
- Brand Awareness – Yes, you CAN measure this. Learn more about measuring brand in our blog.
- Generic Search visibility – How many relevant keywords do you rank for, with search intent?
- Bounce Rate – How well are users resonating with your site?
- Avg. Time On Page – How long are we keeping users for?
- Conversion Rate – How well are we converting users, and which channels and landing pages perform best?
- For paid campaigns: focus on CPA (cost per acquisition). How much is that lead costing you? Did it generate revenue? What is the ROI?
Download our template report for an easy approach to measuring your KPIs.
Interpreting the data.
Numbers alone do not make up an effective report. Instead, the value comes from the way you interpret the data, make clear comparisons and action points for the future.
Things to consider:
- What are the wider market impacts and trends? Are they playing a role in your results?
- What are your objectives and KPIs?
- What is the benchmark, and what are you comparing this new data to?
Use reporting time to reflect on your method, metrics and approach. For example, are you tracking the right things? Is the data good enough? Is the correct tracking set up?
To reference our previous blog, why spend your time doing marketing if you're not learning from the results. Whilst knowing the metrics to focus on is a great starting point, knowing how to interpret this data and make sense of it is crucial. Don't waste your time with top-level stats and no explanation. Once you have your data, there's a process you must go through to ensure the report itself is of value to everyone receiving it.
We've listed below the core pages within a marketing report and questions to ask when analysing your data for better reporting.
Traffic overview
Traffic overview details the number of sessions, how those sessions have arrived on-site (channel and device), plus key audience demographic data.
- Are your sessions up or down?
- What channels are contributing to this?
- Which device is performing best?
- Is the demographic as expected, or is there another revenue opportunity you weren't considering?
Acquisition
Here you can go into more detail around how the traffic got to the site and via which source.
- How much traffic comes via each channel/source? Is there an opportunity for growth?
- What are the paid/organic search volumes?
- Who are the top referrers?
- Are there any unexpected referrers? If so, is this good quality traffic?
Content performance
Looking closely at your content shows best-performing pages on-site based on page views and unique page views. It also provides a snapshot of 'engagement metrics' and includes things like time on page and bounce rate.
- Do core pages receive a high number of page views? Are there any unusual pages that are being viewed?
- How long are users spending on important pages?
- Do important pages have high bounce rates? Does this mean your CTAs (calls to action) aren't clear enough?
- Does the homepage bring the majority of traffic to the site, or is it supported by internal pages?
Organic traffic
This page shows us how users find the site via search engines (e.g. Google), via non-paid means. If a website performs well organically, it means you may not need to pay for Google Ads, and its valuable targeted traffic if done right!
- What are the best performing organic landing pages? This is how users are coming across the site via search engines.
- Is organic traffic bringing new vs returning visitors to the site? Is this in line with your objectives?
- Which devices bring the most traffic organically? Do you need to optimise for other devices?
Search Console
This information is pulled from Google Search Console; the platform helps you monitor and maintain your site's presence in Google Search results. It looks at organic performance only.
- Are impressions increasing or decreasing? (Are the impressions branded or non-branded - you can look at this in Search Console.)
- Does a certain page receive a high number of impressions but no clicks? Is the content targeted enough?
- What countries does the site perform well in? Are these countries relevant to your clients/audience?
- What keywords are performing well? Are these relevant?
Goals & Events
This details goal via the device, source/Medium and new vs returning visitors.
- Are the goals increasing or decreasing? What is the cause?
- What sources/mediums have the highest conversion rate?
- What is the website's conversion rate? Is this good or bad?
- Which goal is performing best?
- Which pages are the best converters? Are they relevant? Are there any other opportunities?
- Which locations convert the best? Are these relevant to your business?
Download our report template to put this process into practice for your business.
Recruitment marketing report checklist.
There are many elements in recruitment marketing, with lots of moving parts spread across multiple channels. This means close monitoring and clear knowledge of your company-wide objectives are essential for insightful marketing that matters.
What to include:
- Include an exec summary - Some people will only look at this bit, so it needs to give a clear snapshot.
- Include buying signals (E.g. page views, bounce rate etc.)
- Conversion metrics (E.g. CV Uploads, MQLs & SQLs etc.)
- Commercial metrics (E.g. Revenue, Candidate Placements etc.)
- Offsite metrics (E.g. Social media, Email Marketing etc.)
- A terminology page (Not everyone will know what a session, impression or goal completion is, so take the time to spell it out and use it as an educational tool for the wider business.)
How to deliver:
Excellent reporting is about more than just the contents. It's also about the delivery. Sending out a report via email alone will only result in confusion, things getting lost in mailboxes and a general lack of interest.
Our advice is to present your reports to those that need to hear them. Take the time to sit people down and explain your findings, what they mean and how you plan on moving forward. When left to simply read a report alone, people can make assumptions about data and miss important aspects. Our tips for delivering reports are:
- Keep it to the point. Reports shouldn't be paragraphs long. Instead, you should be pulling out the headline stats and including concise commentary to explain the findings.
- Don't shy away from the negative numbers. Numbers go up and down, and this is expected. By hiding the bad, you're not showing the complete picture and risk not learning from your results.
- Shout about the good! Now is the time to show what you've achieved, don't be modest.
- Go prepared with questions and ask others to come prepared. This session should be a discussion. You should be getting feedback from the wider company and insights on what they are seeing.
- Identify your personas. Who is this report for? This will change the elements you focus on and how you deliver the report.
Reporting is an essential part of your recruitment marketing strategy and vital for the success of your business, brand and growth. Understanding the data and learning to interpret it takes time, but we're here to make reporting simple. Using the tips we've mentioned in this blog, along with our reporting template, we're aiming to get marketing managers thinking more commercially, improving their strategies and maximising budgets.