

For years Search Engine Optimisation (SEO) was measured through rankings. You would identify the highest volume keywords and focus in on them like a sniper scoping out their target. But in an industry that is unrecognisable to the day I first started in SEO over seven years ago, why do we still obsess with rankings?
Google have long confirmed to make hundreds of changes to their algorithm each year, some of which are more public than others. The last couple of years alone have seen the industry turned on its head, not only in terms of how we do SEO but also how it’s measured.
The announcement back in October 2011 by Google to make search more secure and therefore hide keyword data behind the label of (not provided) within Google Analytics was certainly not welcomed in the industry.
The days of measuring SEO at such a granular level were limited. As each month past we’d lose a few more percent of keyword data until – almost two years after the first announcement – Google started to roll out encrypted search to all users.
Statistics from June 2014 of our top-five highest volume clients show 90.8% of all Google organic searches traced as (not provided).
With all the changes in the industry it’s more important than ever to understand how to best measure SEO in line with your company’s overall objectives.
Stop thinking rankings. Start thinking visibility
First things first – stop focusing on ‘head’ keyword rankings – a good SEO campaign will help improve such rankings but you cannot ignore the wider spectrum of search.
Since 2003 Google has answered 450 billion new unique queries, searches we have never seen before – Google.com
Google handles billions of searches per day of which 16% of keywords are completely new and never been searched for! Attempting to put things into perspective can be difficult, but as a general rule we say that 30% of searches are classed as ‘head’ terms (or in other words, high volume keywords) meanwhile the remaining 70% are ‘long-tail’ which means keywords made up of more than two words.
Following the (not provided) era, some have adopted landing page reports as a way of measuring success. But there’s yet another method that helps you gain an indicative perspective of how your website performs at a granular level.
Google Webmaster Tools search query report enables access to keyword-level data. It may be restricted to a 90-day history and have a two-to-three day lag on the data showing but it certainly comes in handy when calculating your websites visibility.
Downloading the CSV and importing into Excel we are able to – with a few handy formulas – start to segment the data to produce a Pivot Table that can be manipulated to tell a story and help towards measuring the success of an SEO campaign.
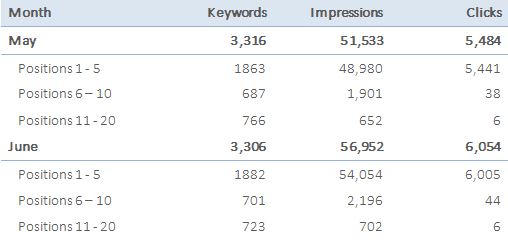
The table above has allowed us to segment by brand / non-brand as well as particular products. Rather than look at the single ‘head’ keyword we can see in fact our client actually ranks for thousands of keywords.
Such a report allows us to calculate visibility which in fact is just one of a number of KPIs we look at within our Campaign Measurement Model.
So let’s not stop at visibility…
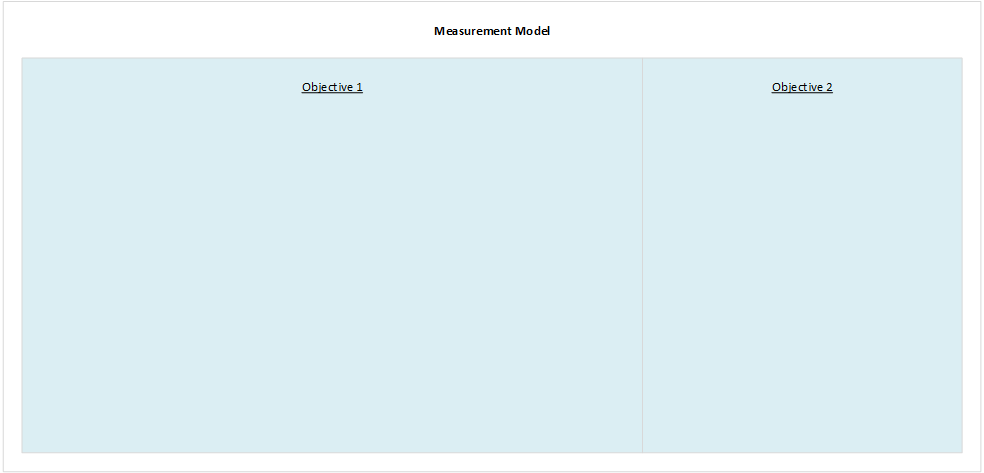
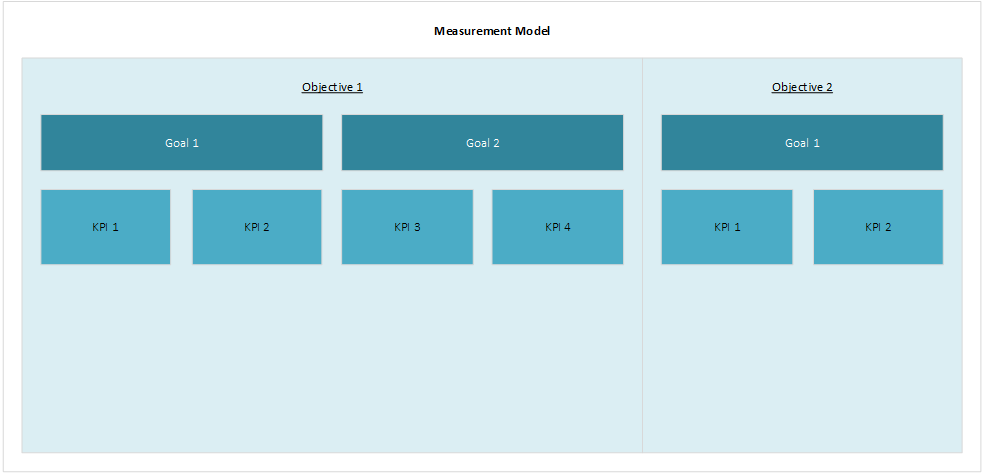
Designing a Measurement Model to Drive Success
Before we can begin to design a Measurement Model for a campaign we’ve got to understand the relationship between the areas of marketing involved e.g. SEO, Social, Paid, the KPIs, Goals and Business Objectives.
Here’s a breakdown of the Measurement Model with questions to that’ll help fill in your model.
1. Define your Objectives
Ask yourself what is the primary purpose of your website? Why do you need this campaign?
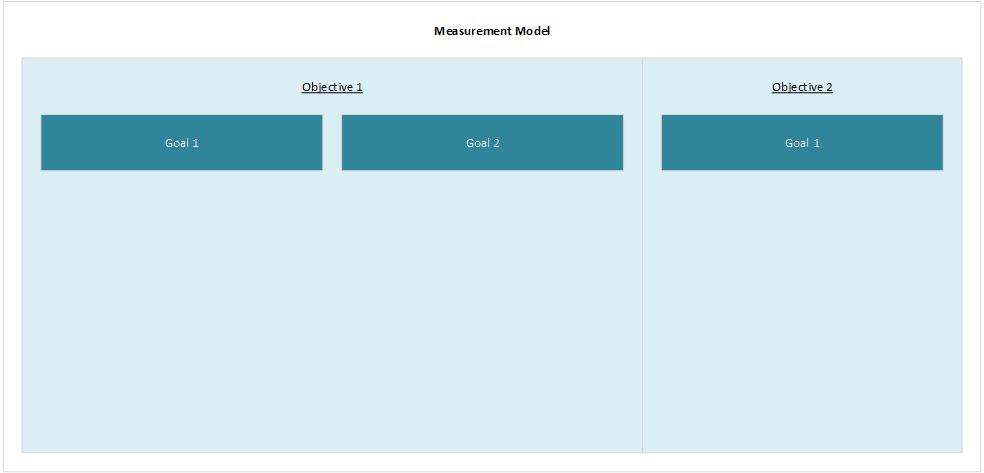
2. Define your Goals for each Objective
How are you going to achieve these objectives? What strategies are in place to accomplish your objectives?
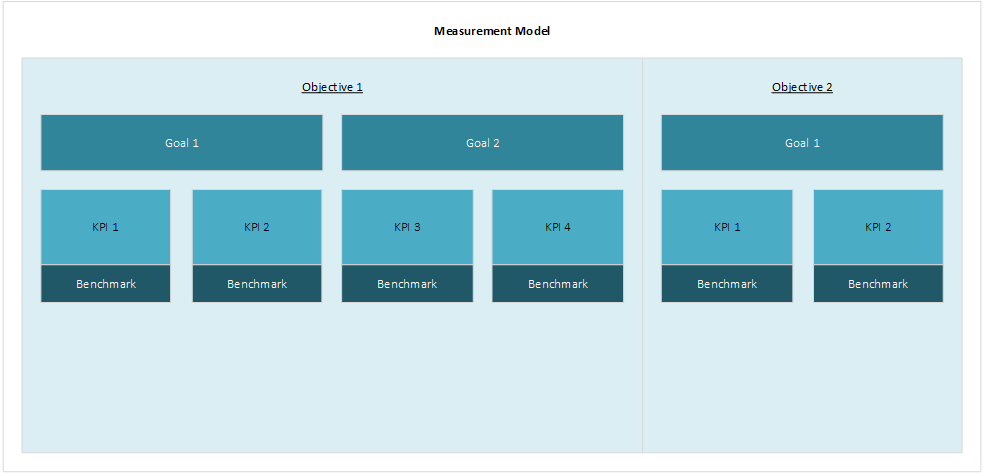
3. Define your KPIs for each Goal
How do you plan to measure your goals? What makes each strategy a success?
4. Define how you’re going to benchmark each KPI
How do you define what is a successful goal? What are you going to benchmark it against? These could also be used as your targets.
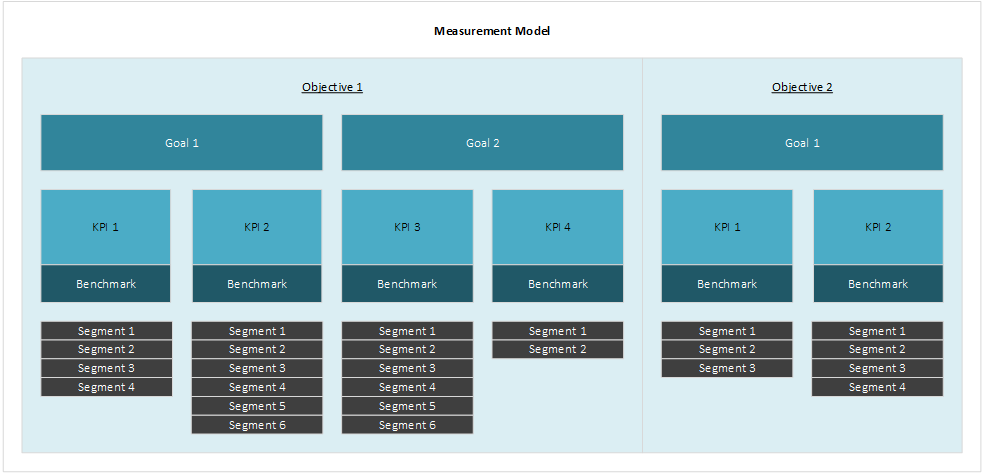
5. Define your segments for each KPI
What contributing data do you need to capture to measure a KPI? For example, Social visits can be segmented by Twitter, Facebook, LinkedIn and Google+
Conclusions
Designing a Measurement Model bespoke to your campaigns will not only help you better understand performance but also helps define relationships as you’ll often find cross-over from different parts of Marketing.
This allows us to make better decisions as to what is required to deliver a successful campaign.
It also allows us to move on from measuring rankings. What’s most important at the end of the day? A single ranking keyword or an increase in revenue?