Introduction to GA4 for Recruitment Websites
22 Nov, 2023


Before you read on, take a minute to think of as many websites as you can. I bet you made at least twenty - probably more. Now think again, out of those that you’ve listed, how many of them display some form of interactive map?
Facebook does. It uses maps to show the locations of events. Local news sites also do, to show where their HQ is or where events or incidents happened. Supermarkets, GPs, shops, offices and business parks all use maps on their websites. The list goes on and on.
It's no secret that an interactive map is the way to go when showing a location. Due to the functionality of Google Maps, it’s simple to do this and show a range of things while also letting users interact with the map in many ways. This is a much better option than just listing an address or directions, but how do they get on site and just how flexible are they?
While Google is not the only mapping service out there, it is quite advanced for its time and the Google Maps API is fully accessible. With some basic JavaScript know how, you can put a basic map that is centred on your location on your site within five minutes. All of the following examples use this API.
The above map is positioned on a latitude and longitude in London - but you could choose to display your business’ base, your favourite city, a holiday destination or the depths of the Bolivian rainforest.
You are also able to choose the zoom level for your map, whether that’s right up close on your office in a busy city or a view of an entire state in the USA to show where you live. For this basic purpose, Google Maps will accommodate for most needs. It's free to sign up and once you have you can start programming maps around all sorts of data.
“But what else can you do?” I hear you cry. How about displaying your user’s location? This can be done with geolocation, by detecting a location based on IP or GPS. Again, JavaScript helps here by allowing the map to request that the user share their location - you might have seen this on the sites you visit with the accompanying tagline ‘to enhance your experience’. If you consent, your location can be detected and this can be used to centre a specific map depending on where you are.
You can go one step further though. Google offers a geocoder service, which accepts an address, town and city, or postcode, and returns the latitude and longitude. Reverse geocoding is the opposite and will give you the text location based on the latitude and longitude. By using geolocation to get a user’s current latitude and longitude, it's easy to detect and show where they are via a pin on the map. Take a look for yourself by giving this example map access to your location. Here's what it shows when accessed from our Wilmslow HQ:
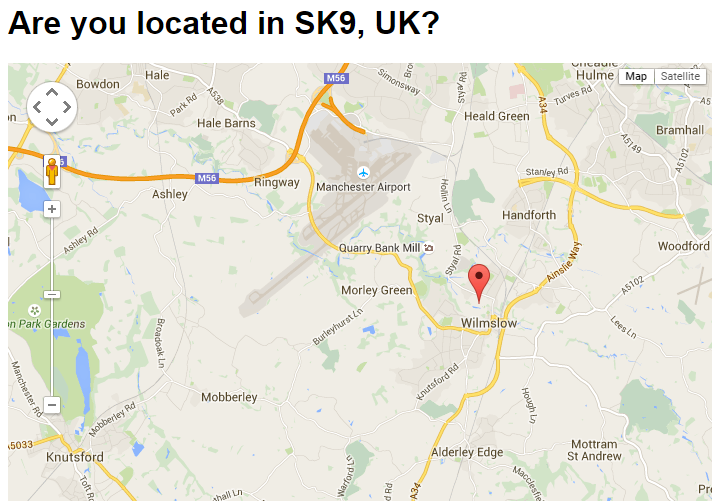
It should pick up and display exactly where you are, and this can be used in countless ways. One way this can be helpful is in determining what information a website shows you. Take this third example map, where we've included a selection of airports across Europe (sorry if your nearest is actually left out). It should show you your nearest airport, as well as the distance to it. Here's our result:
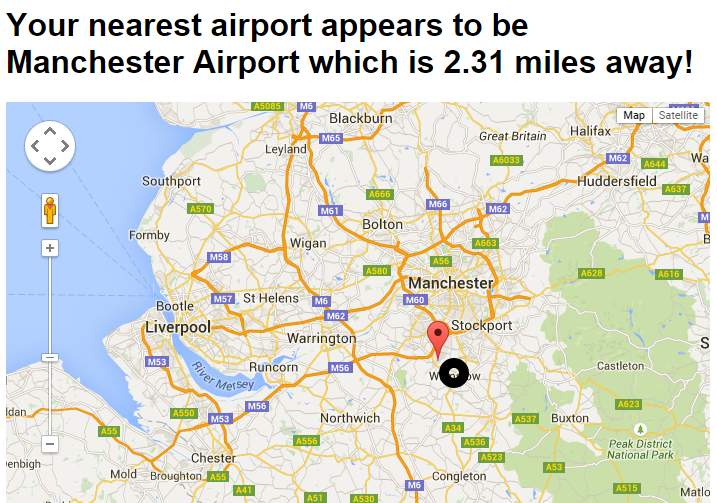
As it is able to calculate the distances between your location and each airport, this information can then be used to make a personalised suggestion about which airport is closest - not that you have to listen to it. You could apply this on any website and direct people to your nearest branch, whether that’s a petrol station, supermarket, gym, bog snorkelling club or anything else.
If an application has your location right now and knows where you want to be, it can provide you with directions. This is one of the most popular features of Google Maps and Satellite Navigation businesses are based on the monetisation of this service. With a bit of extra maths, you can even use maps to predict the cost of a single or regular journey, as we did for GoCompare.
If you are developing a custom solution for this, you can program in options to avoid motorways, highways or toll roads and even tell the service whether you want the fastest or the shortest route. Bear in mind though, that this API is programmed by humans. In an older version of Google Maps, users that searched for directions from Stockholm to California were told to “Swim the Atlantic Ocean for 3,462 miles”. Please, don’t try this. Fortunately, the Sat Nav-like functions have come a long way.
Google Maps isn’t limited to directions and pins – you also can draw shapes, lines, polygons and symbols on the map. This example highlights the area of the Central Business District in Adelaide.
You can add as many shapes as you like, with different colours and opacities in different locations and sizes to illustrate your point to the user. For a business, this is an excellent way to highlight individual or overall coverage zones and visually show the scale of their operations.
Google FusionTables are a cross between an Excel document and a database table on the web, with set permissions for who can access them. These tables of data can be accessed by the Google Maps API to produce point distribution maps, contour plots or heatmaps like this one.
This shows the occurrences of severe weather events across the USA in recent years. The data is a collection of latitudes and longitudes, but it’s possible to use the API to take these points and plots them on the map. The intensity of the colours is based on the density of points plotted together and makes for a more engaging representation than any table could ever aspire to.
These are just the beginnings of what the Google Maps API can do. You could apply the concepts of drawing symbols, points and polygons to many situations, and the results could provide far more information than you could ever achieve through text descriptions alone.
Once you add in FusionTables, the whole concept of data visualisation is opened up and you can display data on maps in any conceivable way you could want to. Taking it further still, you could start using Google Earth for more advanced visualisations – but that is a whole different topic!
Copyright Venn Digital Limited 2023 Cookie Policy Privacy Policy
Site by Venn